// the_story
The Problem
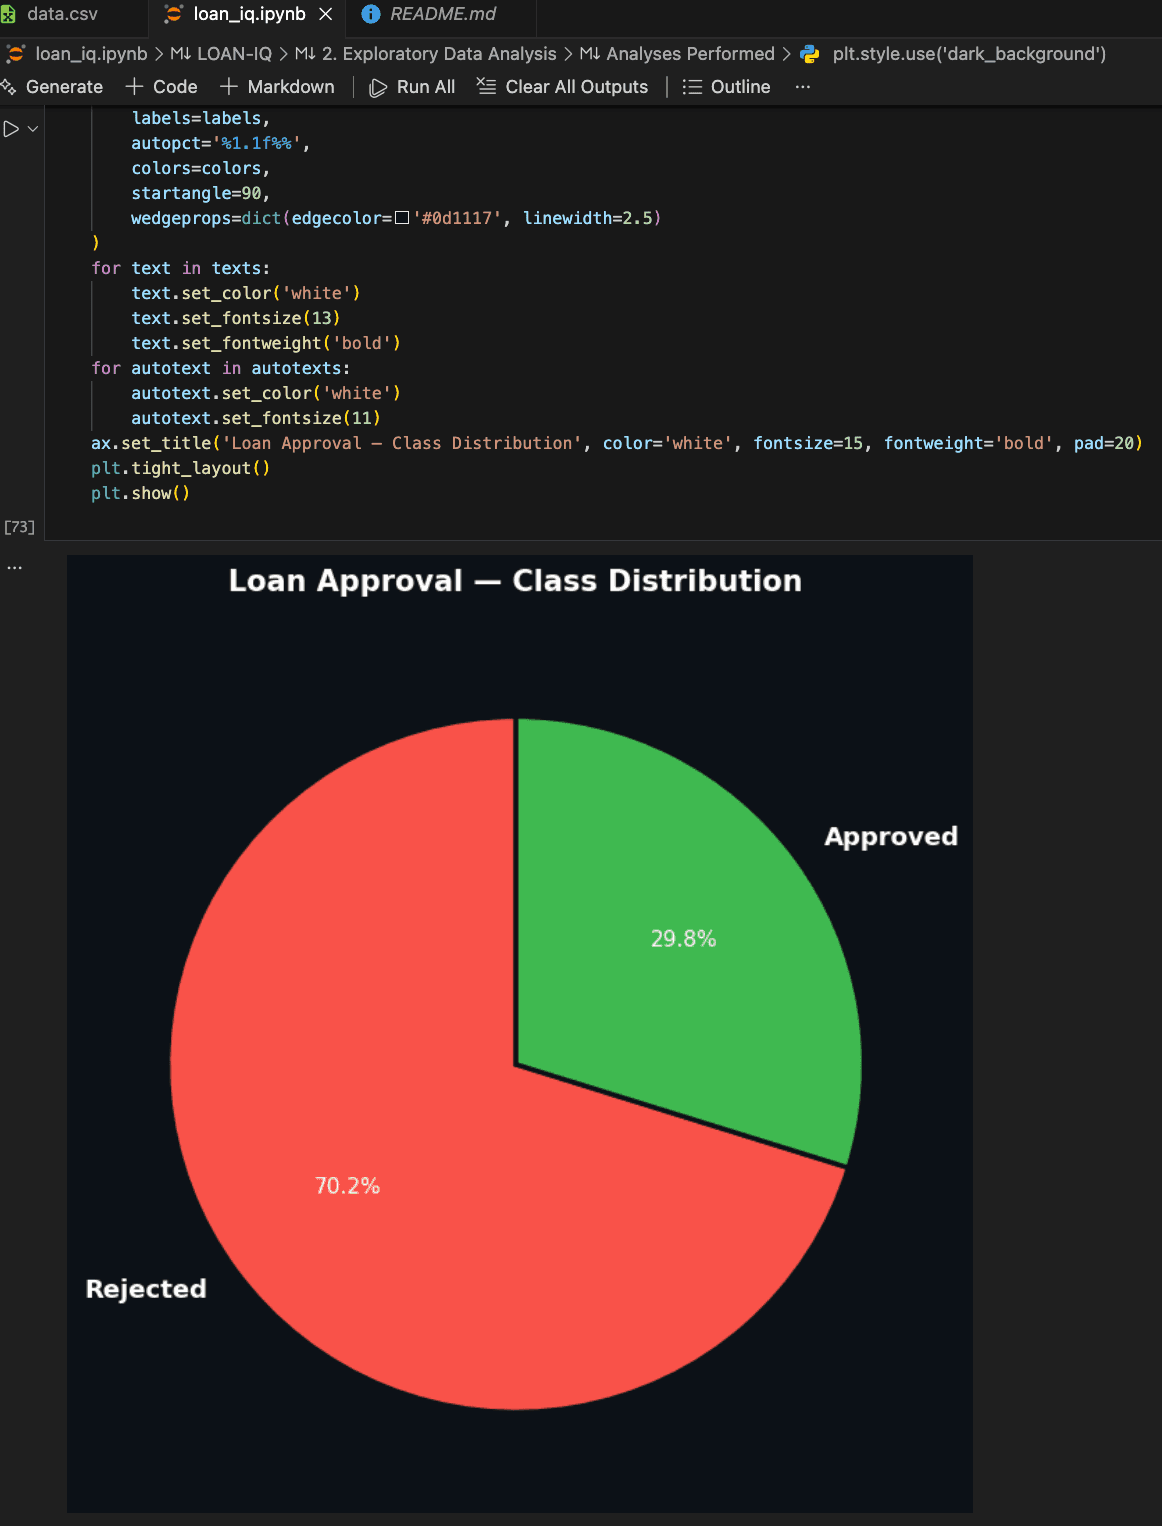
A bank's loan approval process has two ways to fail, and they're not symmetric. Reject a creditworthy applicant — lost revenue, damaged reputation. Approve a high-risk one — direct financial loss. Manual review handles both inconsistently. LoanIQ replaces that inconsistency with a data-driven classification pipeline that flags approve or reject before a human ever looks at the file.
The Pipeline
1,000 loan applications. 20 raw features — income, credit score, debt-to-income ratio, employment status, marital status, loan purpose, and more. The pipeline is straightforward:
- Imputation — mean for numerical columns, most frequent for categorical
- Encoding — One-Hot for nominal categories, Label Encoding for ordinal and the target
- Feature Engineering — polynomial terms for
DTI_RatioandCredit_Score, log transform onApplicant_Incometo compress skew - Scaling — StandardScaler before any distance or gradient-based model
The feature engineering step bumped the feature count from 20 to 27, then trimmed back to 24 after dropping redundant interactions.
What the Data Said
Two features explain most of the signal:
Feature
Correlation with Approval
Credit_Score
+0.45
DTI_Ratio
−0.45
Equal magnitude, opposite direction. High credit score pushes toward approval; high debt-to-income ratio pushes against it. Everything else — income, loan amount, loan term — contributes, but these two dominate. That correlation structure also explained why simpler models performed competitively: when two features carry this much signal, you don't need a deep ensemble to get most of the way there.
The Model Decision
Three models. One clear loser, two close contenders, one non-obvious winner.
KNN (k=9) collapsed — 76% accuracy, F1 of 0.529. High-dimensional, mixed-type tabular data with irrelevant features is exactly where KNN degrades. Distance metrics stop meaning anything when categorical one-hot columns are in the mix.
Logistic Regression and Gaussian Naive Bayes both hit 86–87% accuracy. On raw numbers, they're nearly tied. The deciding metric wasn't accuracy — it was precision.
Model
Precision
Recall
F1
Logistic Regression
0.778
0.803
0.790
Gaussian Naive Bayes
0.804
0.738
0.769
GNB's precision is higher. LR's recall is higher. In a loan approval context, those aren't equivalent tradeoffs — a false approval (low precision) costs the bank money directly; a false rejection (low recall) costs a missed customer. The business cost of approving a bad loan outweighs the cost of declining a good one. GNB wins.
Accuracy is a leaderboard metric. Precision and recall are business decisions. Pick the wrong one and your "86% accurate" model is bleeding money.
Feature engineering helped Logistic Regression — F1 went from 0.777 to 0.790. It had zero effect on Naive Bayes. That's expected: GNB models each feature independently with a Gaussian prior, so adding polynomial terms that are correlated with existing features doesn't add new information.
What I Learned
- Error asymmetry is the first question in any classification problem. Before choosing a model or a metric, ask: which mistake costs more? That answer should drive every subsequent decision.
- Precision vs recall is a business conversation. The model is a tool; the threshold and the evaluation metric encode the actual policy.
- KNN needs feature selection. Distance-based models degrade fast in high-dimensional, mixed-type spaces. That's not a tuning problem — it's a structural mismatch.
- Feature engineering isn't universally helpful. Polynomial terms improved the model that could use them (LR), and did nothing for the model that couldn't (GNB). Understanding why a transformation helps requires understanding the model's assumptions.
A 1,000-row dataset and three classical models. The interesting part wasn't the accuracy number — it was making a defensible argument for which model to ship.